Climate of Vancouver
The climate of Vancouver, British Columbia, is a temperate oceanic climate characterized by mild, wet winters and warm, dry summers, heavily influenced by its coastal location and proximity to the Pacific Ocean. This climate makes Vancouver one of Canada's warmest major cities, with a growing season significantly longer than eastern counterparts like Toronto. The region experiences distinct seasonal patterns, including frequent rainfall from autumn through spring and notable microclimates due to its varied terrain. Understanding Vancouver's weather is crucial for residents, visitors, and industries, as it shapes daily life, agriculture, and infrastructure while presenting unique challenges such as heavy rain events and occasional snow.
General Climate and Influences
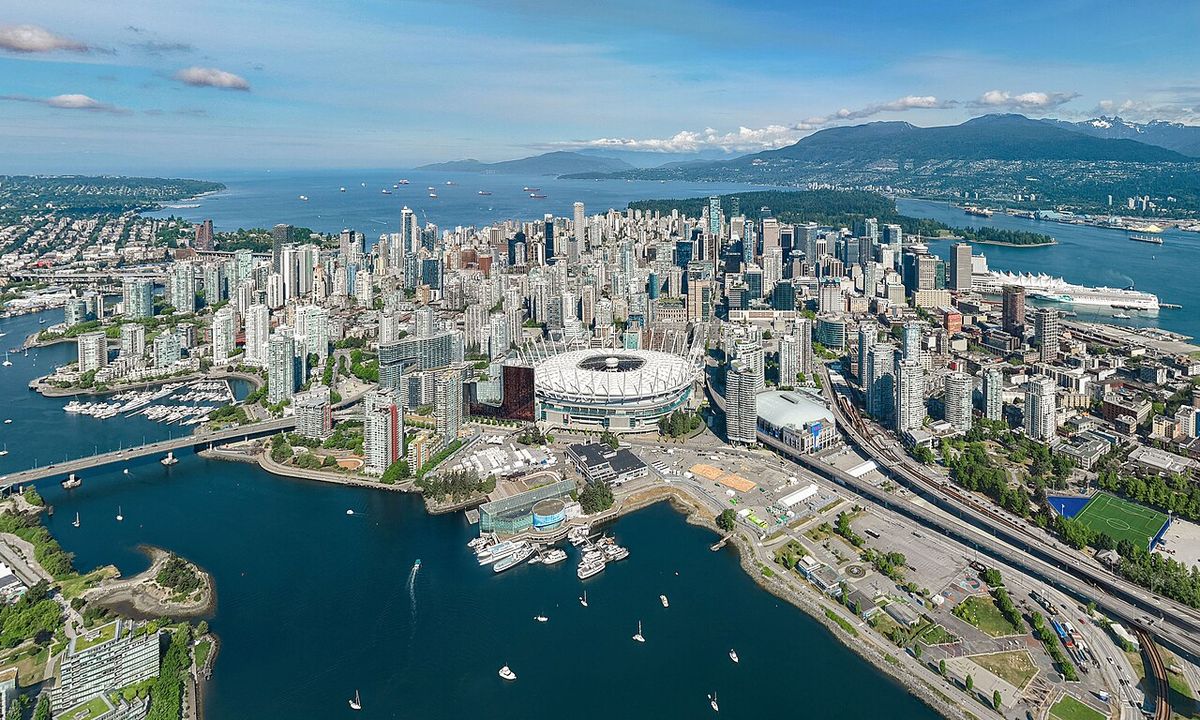
The climatology of Vancouver applies broadly to the Greater Vancouver region, an area defined by significant microclimates due to its complex topography and coastal influences. While the Alaska Current, originating from the North Pacific Current, moderates temperatures year-round, local weather can vary dramatically over short distances. The mountainous terrain, particularly the North Shore Mountains, interacts with onshore winds to create distinct precipitation patterns, with higher elevations receiving substantially more rain. Predicting weather in this region is notably complex, especially snowfall, as temperatures often hover near freezing during winter precipitation events. The interplay of sea breezes, elevation changes, and Pacific air masses makes Greater Vancouver a fascinating study in localized climate effects.
A rule of thumb for the region states that for every 100-metre rise in elevation, an additional 100 millimetres of precipitation is expected, explaining why the District of North Vancouver receives double the rainfall of the airport. This elevation-driven precipitation gradient is a key factor in the diverse ecosystems and water supply across the metro area. The region's sheltering by the mountains of Vancouver Island to the west provides some protection from Pacific storms, but also contributes to the frequent cloudy and overcast skies experienced from late fall through spring. These general climatic conditions set the stage for the specific temperature, precipitation, and severe weather patterns detailed in the following sections.
Temperature Patterns
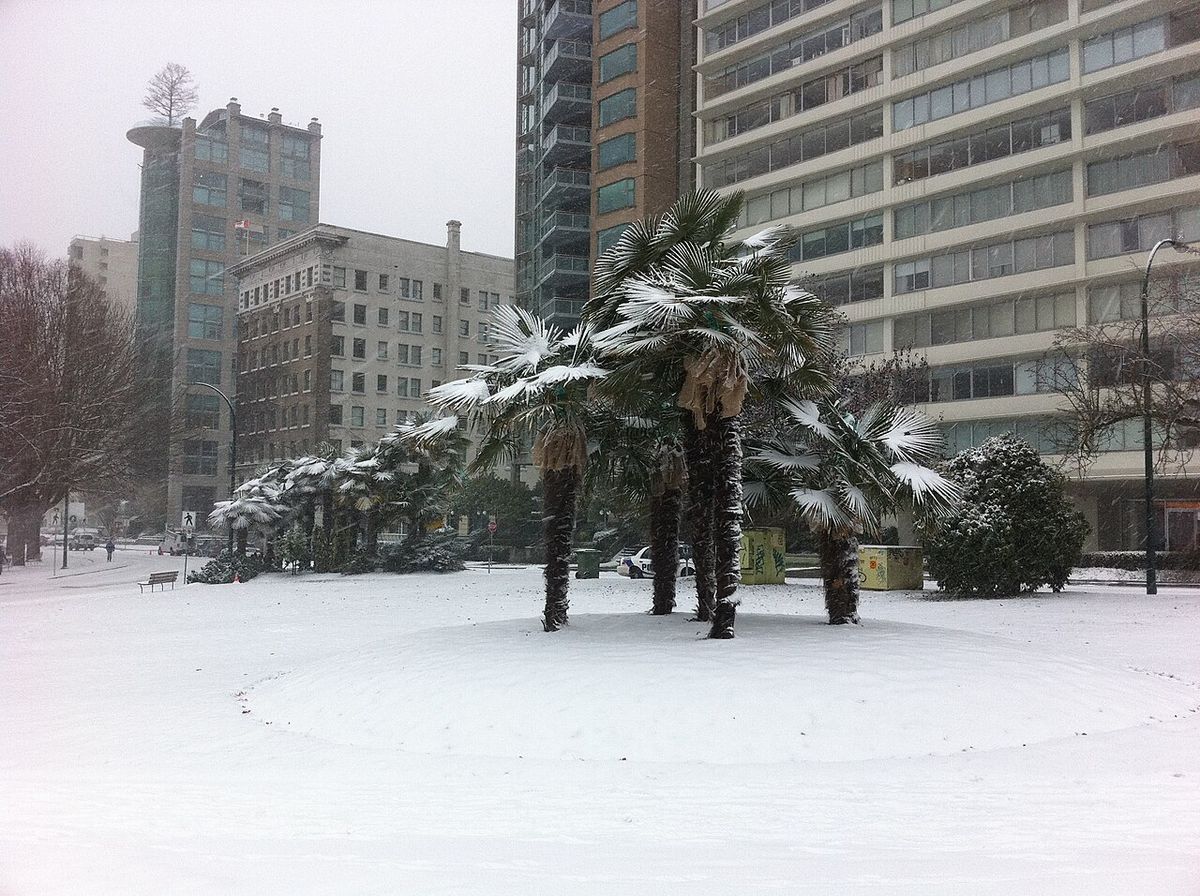
Vancouver's temperatures are among the mildest in Canada, with an average annual temperature of 11.0 degrees Celsius downtown and 10.4 degrees at Vancouver International Airport. This semi-mild climate supports a long growing season averaging 221 days, from late March to early November, which is 72 days longer than Toronto's season. The region falls within USDA plant hardiness zone 8, comparable to coastal cities like Seattle and Amsterdam, and sustains hardy plants like the Windmill Palm. Despite the general mildness, winter can bring occasional cold spells known as Arctic outflows, where cold continental air flows down the Fraser Valley, occurring on average one to three times per winter.
The coldest month on record at the airport was January 1950, with an average low of -9.7 degrees Celsius and an average high of only -2.9 degrees, resulting in a daily average of -6.3 degrees, which is 10 degrees colder than normal. The coldest temperature ever recorded in the city was -18.3 degrees on December 29, 1968, while the coldest across Metro Vancouver was -23.3 degrees in Pitt Meadows on January 23, 1969. Summer temperatures show significant variation across the metro area, with inland regions of the Fraser Valley often being 5 to 10 degrees Celsius warmer than coastal areas when onshore breezes are not present. Conversely, winter temperatures tend to be a couple of degrees cooler inland compared to the immediate coast.
The arrival of spring is often noticeable in late February with milder temperatures and the return of flowering perennials such as cherry trees, which were seen blooming during the 2010 Winter Olympics. However, some years can also bring late snowstorms and cold temperatures even as the season changes. The sustained mildness allows many cold hardy flowers to remain in bloom throughout the winter, commonly seen in gardens and office exteriors. This extended period of plant activity is a direct result of the maritime influence and the scarcity of prolonged deep freezes.
Precipitation and Rainfall
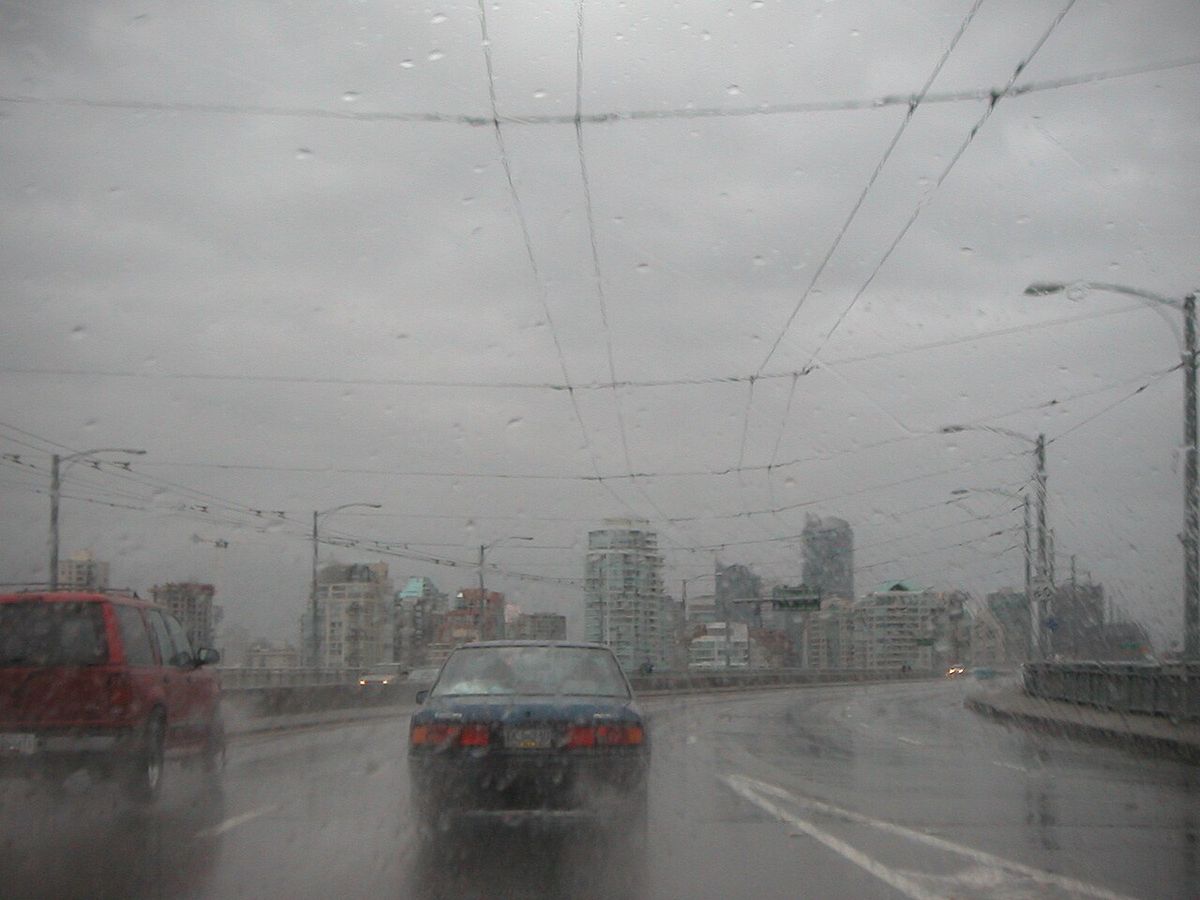
Vancouver is Canada's third rainiest city, experiencing an average of 169 rainy days per year. Measured at Vancouver Airport, the city receives 1,189 millimetres of rain annually, but this amount doubles to 2,477 millimetres in North Vancouver due to orographic lift at the base of Grouse Mountain. The city lacks a hot summer, making convective thunderstorms rare, with an average of only 6.1 thunderstorm days per year. Summers are typically dry, with July and August often experiencing weeks without rain, and July is historically the driest month. In fact, July 2013 saw no measurable rainfall at the airport, the first such occurrence in recorded history, and July 2021 also recorded no rain at all.
The weather in spring and autumn is usually characterized by showers, cool temperatures, and overcast skies. The grass-cutting season typically runs from March through October, though unwatered lawns in summer may not need cutting for extended periods due to the dry conditions. While Vancouver is one of Canada's driest cities in summer, the rest of the year is dominated by low-pressure systems that bring consistent rainy weather from fall through mid-spring. The complex precipitation patterns are a defining feature of life in the region, influencing everything from water reservoir management to outdoor activities. Many other Julys have recorded less than 1 millimetre of rain, highlighting the reliability of the summer dry period.
In contrast to the dry summers, other Julys and Augusts can experience several very wet days in a row, demonstrating the variability within the seasonal pattern. The shift from the stable high-pressure systems of summer to the rainy low-pressure systems of fall is a major annual transition. Predicting precipitation in Greater Vancouver is particularly complex due to the microclimates, with local variations sometimes more exaggerated than in other coastal areas. This unpredictability requires residents and city services to be adaptable, especially regarding water usage and stormwater management.
Snowfall and Winter Conditions
Contrary to a common misconception, Vancouver does receive snow, with traceable amounts observed at the airport every year on record. Environment Canada ranks Vancouver third for lowest snowfall among major Canadian cities, with an average of only 8.7 days per year with snowfall above 0.2 centimetres. Snow tends to be wet and heavy, often leading to icy road conditions as temperatures fluctuate around freezing. Snowfall is more common and heavier in higher-lying areas like Burnaby Mountain, Coquitlam, and the North Shore, but it can accumulate at sea level in all months except June, July, and August. The city's coastal climate also places it 59th for 'Most huge snowfall days', averaging 0.13 days annually with accumulations above 25 centimetres, which is above cities like Calgary and Toronto.
Significant snow events, while infrequent, have occurred throughout history. The snowiest year on record was 1971, with a total of 242.6 centimetres at the airport, including a single-day snow depth of 61 centimetres on January 15. In that same January, more than 120 centimetres of snow fell. In November 2006, an extraordinary 25.5 centimetres of snow fell in a 24-hour period across the Lower Mainland. The city budgets $400,000 annually for snow removal equipment, training, and de-icing salt, but actual removal costs vary widely, from $1.1 million in 1998 to $0 in 2001, funded separately from contingency reserves. The low frequency of snowfall makes large investments in snow removal infrastructure difficult to justify, as thaw conditions usually arrive before street plowing is complete.
Blizzards are extremely rare, but heavy snowfall events are more common, such as one in 1996 that resulted in over 60 centimetres of snow and caused millions of dollars in damage. The frequency of White Christmases has increased, with a 20 percent chance according to 2011 data, up from 11 percent. Memorable White Christmases occurred in 2008 after weeks of cold and four consecutive storms left over 60 centimetres on the ground, with 41 centimetres measured on Christmas Day, and in 1998 when 20 centimetres was on the ground. Despite certain periods seeing higher snow frequency, annual winter snowfall has generally decreased over the last two decades.
- Snowiest year: 1971 (242.6 cm at Vancouver Airport)
- Greatest snow depth: 61 cm (January 15, 1971)
- Notable recent snow event: November 2006 (25.5 cm in 24 hours)
- White Christmas examples: 2008 (41 cm on ground), 1998 (20 cm on ground), 2007 (1 cm measured)
- Year with no measurable snow: 2015 (only a trace recorded on December 17)
- Average annual days with snow >0.2 cm: 8.7 days
- Snowfall surpassing 100 cm: Occurred twice in the 1990s
Severe Weather Events
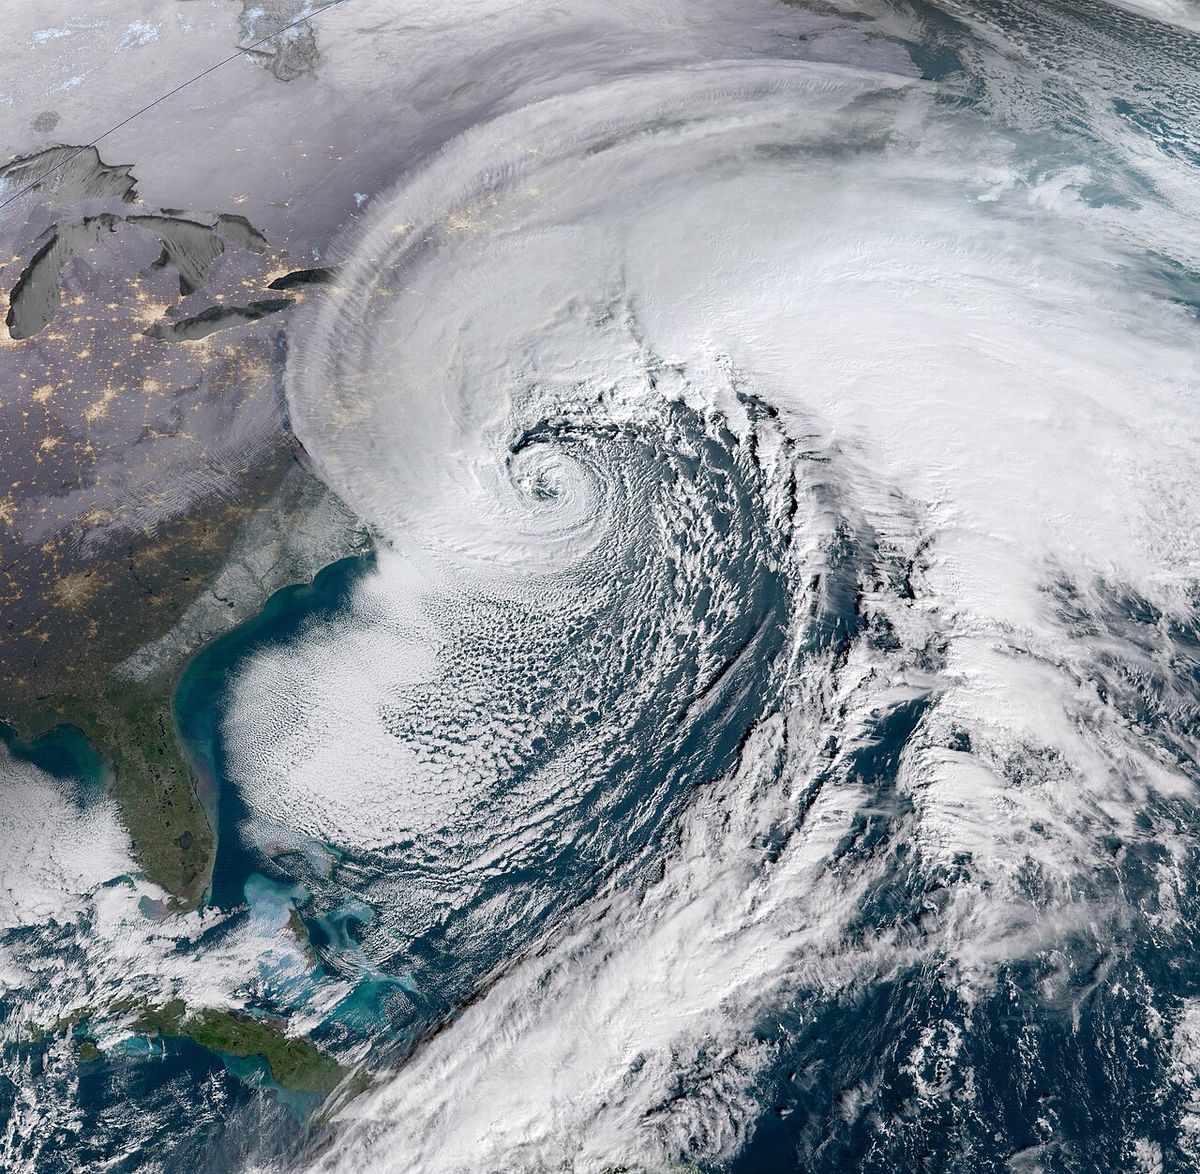
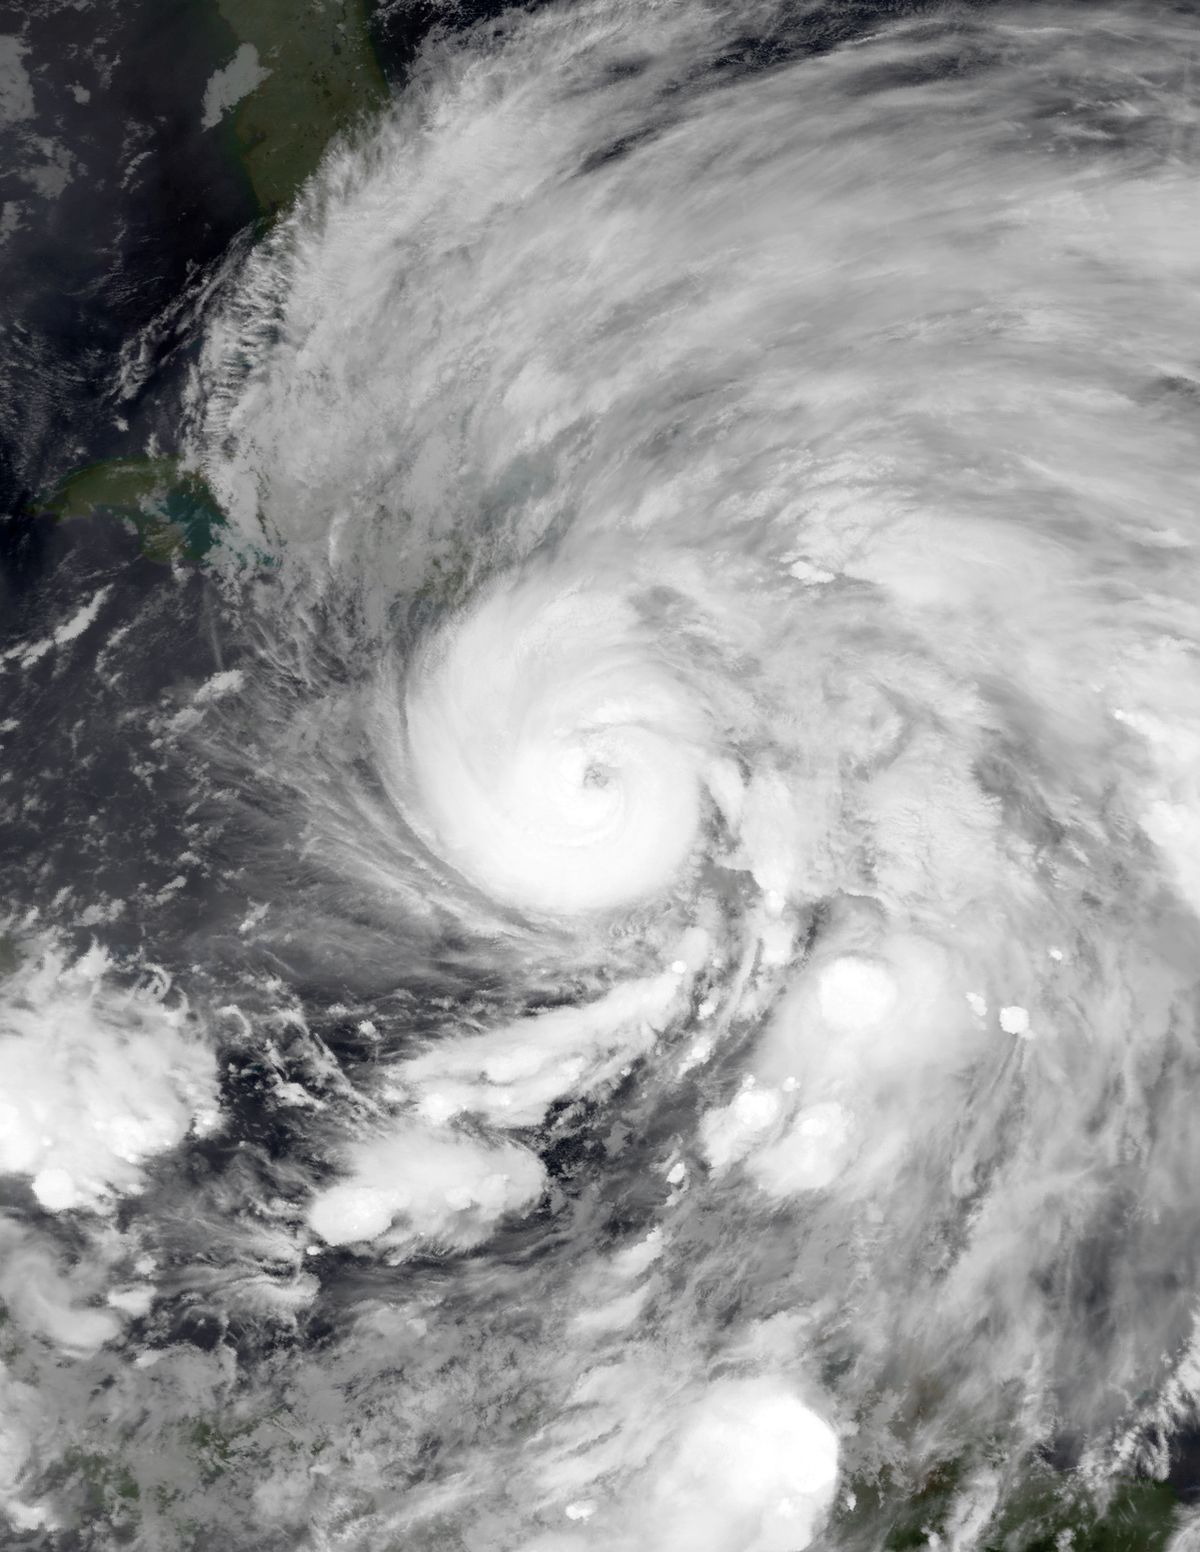
While gales are unlikely in autumn, Greater Vancouver has experienced several destructive wind storms throughout its history. Three major storms have caused extensive damage to the forests of Stanley Park, each knocking down large swathes of trees. The first occurred in October 1934, with a subsequent blizzard in January compounding the damage. The second was the remnant of Typhoon Freda in 1962, which levelled a 2.4-hectare tract of forest, now the site of the park's miniature railroad. These events highlight the region's vulnerability to Pacific weather systems, including the remnants of tropical cyclones.
The November 2006 period was particularly severe, featuring both heavy rainfall and significant snowfall. Rainfall in the first 16 days of the month broke a previous record of 18.1 centimetres when 25.5 centimetres fell, washing sediment into reservoirs and leading to advisories for businesses to stop serving beverages made with tap water. Later in the month, a snow event dropped 28 centimetres at the airport from November 25 to 27, with temperatures dropping to -12 degrees on November 28. On November 29, an additional 10 centimetres of snow fell, resulting in the closure of public institutions and power outages in Surrey and Langley.
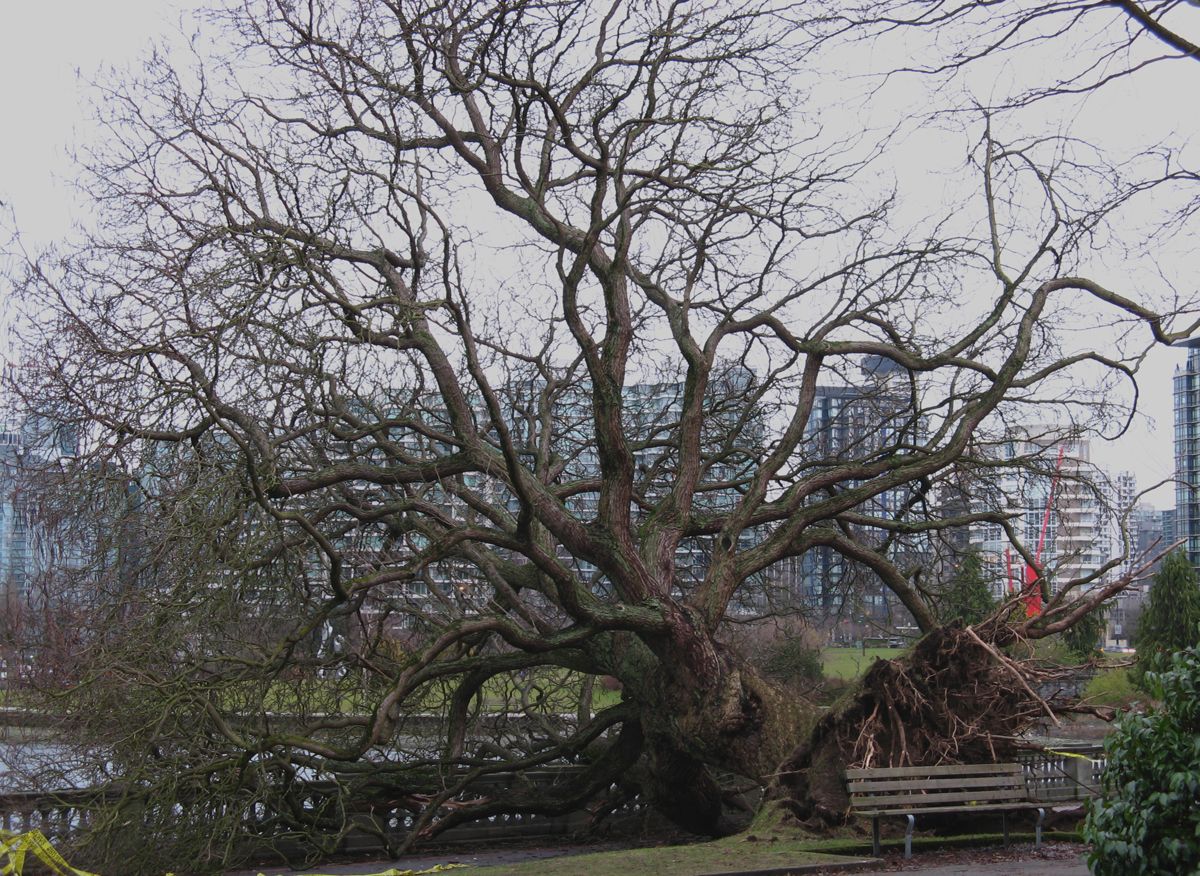
The Hanukkah Eve windstorm of December 15, 2006, swept through with winds from 70 to 125 kilometres per hour. In Stanley Park, it damaged or uprooted over 5,000 trees and caused mudslides that destroyed a section of the seawall. Insured damages throughout British Columbia were expected to reach $40 million, with repairs to Stanley Park alone estimated at $9 million. This storm series from late 2006 demonstrates how consecutive severe weather events can strain municipal resources and cause long-term environmental and infrastructural damage.
Climate Statistics and Records
Climate data for Greater Vancouver reveals significant variations across different monitoring stations, highlighting the region's microclimates. Record high temperatures have been set in recent years, notably during the June 2021 heat dome, with Pitt Meadows recording 41.4 degrees Celsius. Conversely, record low temperatures demonstrate the reach of Arctic outflows, with the city's coldest being -18.3 degrees in 1968. Precipitation records show a stark contrast between coastal and mountainous sites, with North Vancouver receiving more than double the rainfall of the airport. The detailed records from various stations provide a comprehensive picture of extreme weather potential across the metropolitan area.
| Location | Record High Temp. | Notable Humidity/Dew Point Record |
|---|---|---|
| Vancouver Airport (YVR) | 34.4 °C (July 30, 2009) | Record high dew point: 23.0 °C (July 29, 2022) |
| Vancouver Harbour | 34.9 °C (July 29, 2009) | Warmest month (mean temp.): 21.0 °C (Aug 2022) |
| West Vancouver | 40.6 °C (June 27, 2021) | Record high dew point: 21.2 °C (July 20, 1997) |
| Pitt Meadows | 41.4 °C (June 28, 2021) | Record high dew point: 21.8 °C (July 22, 2006) |
| White Rock | 38.5 °C (June 28, 2021) | Record high dew point: 22.0 °C (July 29, 2009) |
Additional notable records include the warmest month at Vancouver Airport being July 1958 with a mean temperature of 20.6 degrees and an average daily maximum of 25.5 degrees. The most humid month at the same station was August 2022 with an average monthly dew point of 16.5 degrees. The data also shows longevity records, such as July 1958 having no daily maximum temperature below 21.7 degrees and August 2004 having no temperature below 13.2 degrees at the airport. The lowest yearly maximum temperature recorded at the airport was 24.4 degrees in 1954, a figure that has been exceeded many times since, indicating a trend toward warmer extremes.
Records from other stations show similar patterns of recent warmth. West Vancouver's warmest monthly average daily maximum was 26.1 degrees Celsius recorded during August 2022. Pitt Meadows' warmest monthly mean temperature was 21.5 degrees Celsius also in August 2022. The average yearly maximum dew point at Vancouver Airport is 18.7 degrees Celsius. At Vancouver Harbour, the average yearly maximum dew point is 18.1 degrees Celsius. These statistics are vital for urban planning and public health during heat waves. They are also important for agriculture and for understanding long-term climate trends in the region.
Daylight and Seasonal Patterns
Vancouver's relatively high latitude, similar to Paris, France, results in large seasonal variations in daylight. In winter, sunsets can occur as early as 4:10 PM and sunrises as late as 8:12 AM. From November to February, more than 70 percent of the already short daytime is completely cloudy on average at the airport, with even higher cloudiness in Vancouver proper and the North Shore due to upslope winds. As a result, Vancouver averages less sunshine in a typical winter than any other major Canadian city, contributing to its reputation for grey skies. The percentage of cloudiness increases in the city and especially the North Shore because winds moving up the mountainsides lead to cloud development.
Summer presents a nearly opposite pattern, with consistent high pressure and sunshine. July and August are the sunniest months. Near the summer solstice, the period between sunset and sunrise is less than eight hours, and with daylight saving time in effect, civil twilight can last past 10 PM. This extended evening light is a cherished feature of Vancouver summers, supporting outdoor activities and tourism. The stark contrast between the dark, cloudy winters and the bright, long summer evenings defines the seasonal rhythm of life in the city. The fleeting nature of summer is offset by its reliable sunshine and pleasant temperatures, with July 1958 at the airport seeing no daily maximum temperature below 21.7 degrees.
Ecological and Social Impacts
Vancouver's climate directly shapes its natural environment and urban infrastructure. The mild, wet winters allow many cold-hardy flowers to remain in bloom throughout the season, common in gardens and commercial landscapes. The long growing season supports a variety of horticulture and contributes to the city's lush, green appearance. However, the infrequency of snowfall means the city is not equipped with extensive snow removal infrastructure, leading to significant disruptions when snow does fall, including school closures and traffic problems. The budgetary approach to snow removal, with costs funded from contingency reserves, reflects this intermittent challenge, and even small amounts of snow can cause major issues.
The climate also influences water management, as seen during the heavy rains of November 2006 which contaminated reservoirs, and forestry, with windstorms causing repeated damage to Stanley Park. The increasing frequency of extreme heat events, as recorded in 2021, poses new challenges for public health and building design. The decrease in annual winter snowfall over the past two decades, despite periods of heavier snow, suggests ongoing climatic shifts that residents and planners must continue to monitor and adapt to for the future. The city's ranking for low snowfall but relatively high ranking for huge snowfall days illustrates the unpredictable and occasionally severe nature of its winter weather.
The social impacts are wide-ranging, from the choice of plants in landscaping, which includes hardy species like the Windmill Palm, to the economic costs of storm damage and snow removal. The weather affects daily commutes, with icy roads from wet snow being a particular hazard, and influences tourism patterns, with summer being the peak season for visitors. The region's weather patterns are a constant topic of conversation and planning, integral to the identity and functioning of Metro Vancouver. The ability of the climate to sustain a long growing season also has agricultural implications for the surrounding Fraser Valley, where the growing degree days are fewer than in southern US cities like Dallas despite sharing a plant hardiness zone.
Questions about Climate of Vancouver
Does it snow in Vancouver?
Yes, it does snow in Vancouver, contrary to a common misconception. Traceable snow has been observed at Vancouver International Airport every year on record. However, snowfall is infrequent and generally light at sea level, with an average of only 8.7 days per year with snowfall above 0.2 centimetres. Snow is more common and heavier in higher elevation areas like the North Shore. Significant snow events do occur, such as in 1971, which was the snowiest year on record with 242.6 centimetres, and in November 2006 when over 25 centimetres fell in 24 hours.
What is the warmest temperature ever recorded in Vancouver?
The highest temperature recorded in the Greater Vancouver region was 41.4 degrees Celsius in Pitt Meadows on June 28, 2021, during a historic heat dome. Within the City of Vancouver, the record high at the official Vancouver Harbour station is 34.9 degrees Celsius, set on July 29, 2009. At Vancouver International Airport, the record high is 34.4 degrees, also set in July 2009. These extreme highs are exceptional, as Vancouver's summers are typically characterized by moderate warmth due to the tempering influence of the Pacific Ocean, with average July highs around 22 degrees Celsius.
Why does Vancouver get so much rain?
Vancouver receives significant rainfall due to its coastal location and proximity to the Pacific Ocean, which supplies moist air masses. The region's mountainous terrain, particularly the North Shore Mountains, forces this moist air to rise, cool, and condense, leading to precipitation. This orographic effect means precipitation amounts increase dramatically with elevation. North Vancouver receives about 2,477 millimetres of rain per year, more than double the 1,189 millimetres recorded at Vancouver Airport. Storm systems from the Pacific are most active from October through March, resulting in the wet winter season.
What is a White Christmas and how often does Vancouver have one?
A White Christmas in Canada is defined by Environment Canada as having at least 2 centimetres of snow on the ground on Christmas Day. According to 2011 data, Vancouver's chance of a White Christmas is 20 percent, an increase from a historical 11 percent. Notable White Christmases occurred in 2008, with 41 centimetres of snow on the ground, and in 1998 with 20 centimetres. Snow was also present in 2007, though only 1 centimetre was measured at the airport. These events are memorable due to their relative rarity in the city's typically mild winters.
What was the most damaging storm in Vancouver's history?
Several severe wind storms have caused significant damage. The Hanukkah Eve windstorm of December 15, 2006, was particularly destructive, with winds up to 125 km/h damaging over 5,000 trees in Stanley Park, causing mudslides, and resulting in an estimated $40 million in insured damages across British Columbia. The remnant of Typhoon Freda in 1962 also caused major damage, levelling a 2.4-hectare section of Stanley Park's forest. The November 2006 storms were also notable, combining record rainfall that contaminated water reservoirs with heavy snowfall that caused widespread power outages and closures.
How does Vancouver's climate compare to Toronto's?
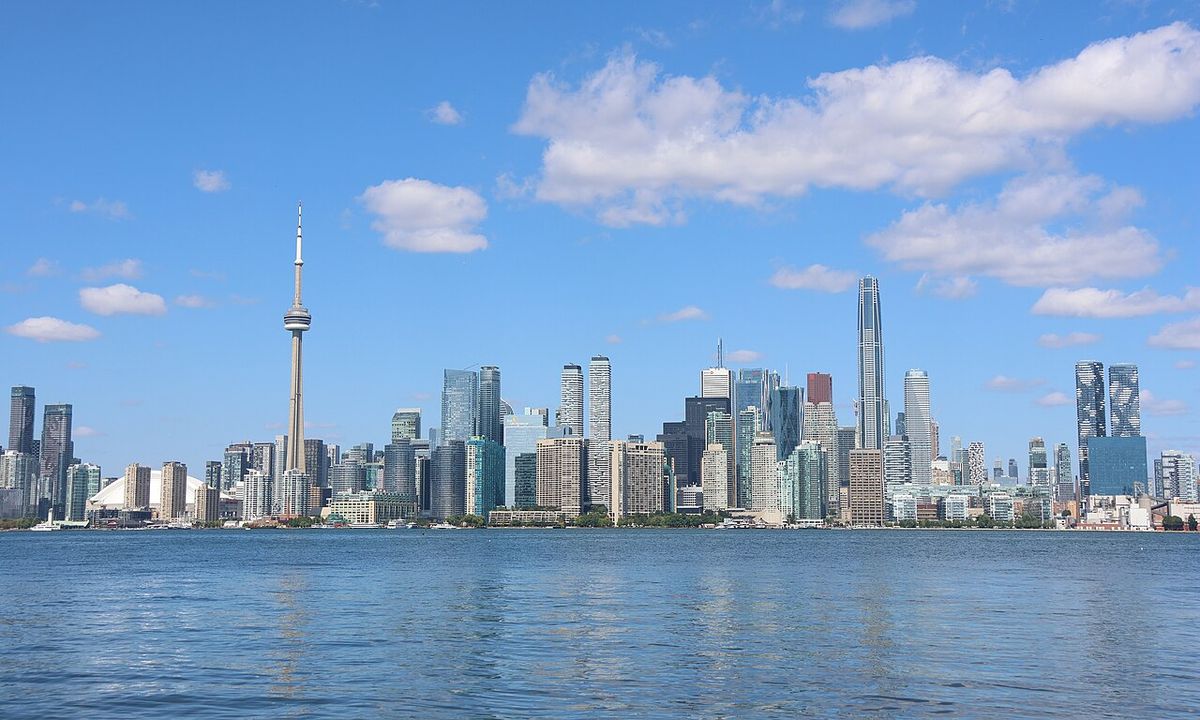
Vancouver has a significantly longer growing season and milder winters than Toronto. Vancouver's growing season averages 221 days, which is 72 days longer than Toronto's. This is partly due to Vancouver's warmer average annual temperature of 11.0 degrees Celsius downtown, one of the warmest in Canada. The city's climate is tempered by the Alaska Current and sheltered by Vancouver Island, leading to semi-mild winters. In contrast, Toronto experiences colder winters and hotter summers. Vancouver averages less sunshine in winter than any other major Canadian city, and it is Canada's third most rainy city with 169 rainy days per year.
Sources and further reading
- Climate of Vancouver (Wikipedia)
- Vancouver, BC - 7 Day Forecast (weather.gc.ca)
- Impacts of climate change, CleanBC (cleanbc.gov.bc.ca)
- Wetter Conditions & Flood (bcclimatechangeadaptation.ca)
- Heat waves and extreme heat in Canada (climateinstitute.ca)
Checked by the Your Space Hamilton desk. Last updated 2026-10-21.