Demographics of Toronto
The demographics of Toronto, Ontario, reflect one of the most multicultural and multiracial urban populations in the world. According to the 2021 census, 55.7 percent of the city's residents identified as a visible minority, a figure that rises to 57.0 percent for the broader Toronto Census Metropolitan Area. This diversity is a defining characteristic of Canada's largest city, which had a population of 2,794,356 within its municipal boundaries as of 2021. The city's rapid demographic evolution, driven significantly by immigration, shapes its neighbourhoods, culture, and economy, making it a central focus for national discussions on urban growth and integration.
Population Growth and Structure
Toronto's population continues to expand, though the pace and sources of growth have shifted in recent years. The city's population grew by 2.3 percent between the 2016 and 2021 censuses, representing an annual growth rate of 0.46 percent. This growth has been driven overwhelmingly by international migration, with nearly a quarter of all new immigrants to Canada settling in the Toronto region. While non-permanent residents became a major source of growth, the region experienced a net loss in interprovincial migration, with more people leaving for other provinces like Alberta than moving in from within Canada.
The age structure of the city, as last detailed in the 2016 census, reflects a diverse and growing population. The distribution across community councils shows varying demographic profiles, with Scarborough having the youngest average age and the highest proportion of visible minorities. Population growth within the city has not been uniform, with areas like the former municipalities of Scarborough and North York experiencing more significant increases compared to the older urban core. The city's physical expanse of 641 square kilometres accommodates this growth, stretching 43 kilometres from east to west. Current estimates project the city's population to reach approximately 3,358,275 by 2026, which confirms its continued status as Canada's most populous municipality.
Ethnic and Visible Minority Composition
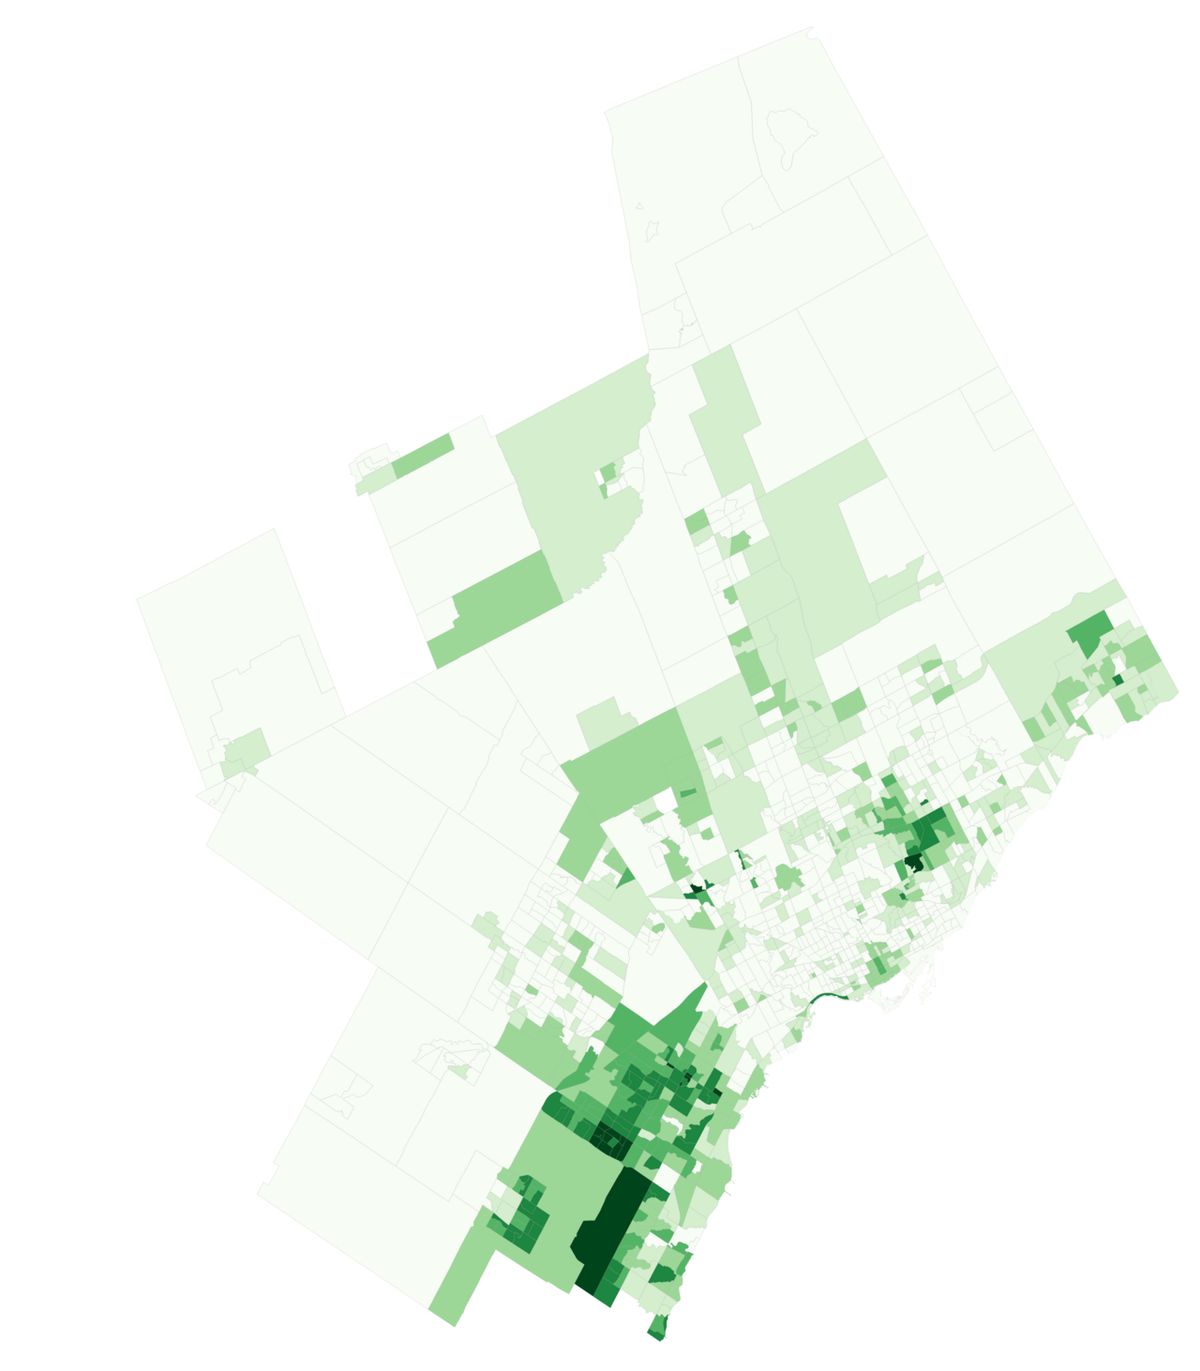
The ethnic composition of Toronto is exceptionally diverse, with no single group forming a majority. As of the 2021 census, 55.7 percent of the city's population identified as a member of a visible minority group. This represents a significant increase from 1981, when only 13.6 percent of the CMA's population was a visible minority. The change between 2011 and 2016 saw notable increases in the Filipino, Black, Chinese, and South Asian populations, while the number of residents identifying solely as White decreased.
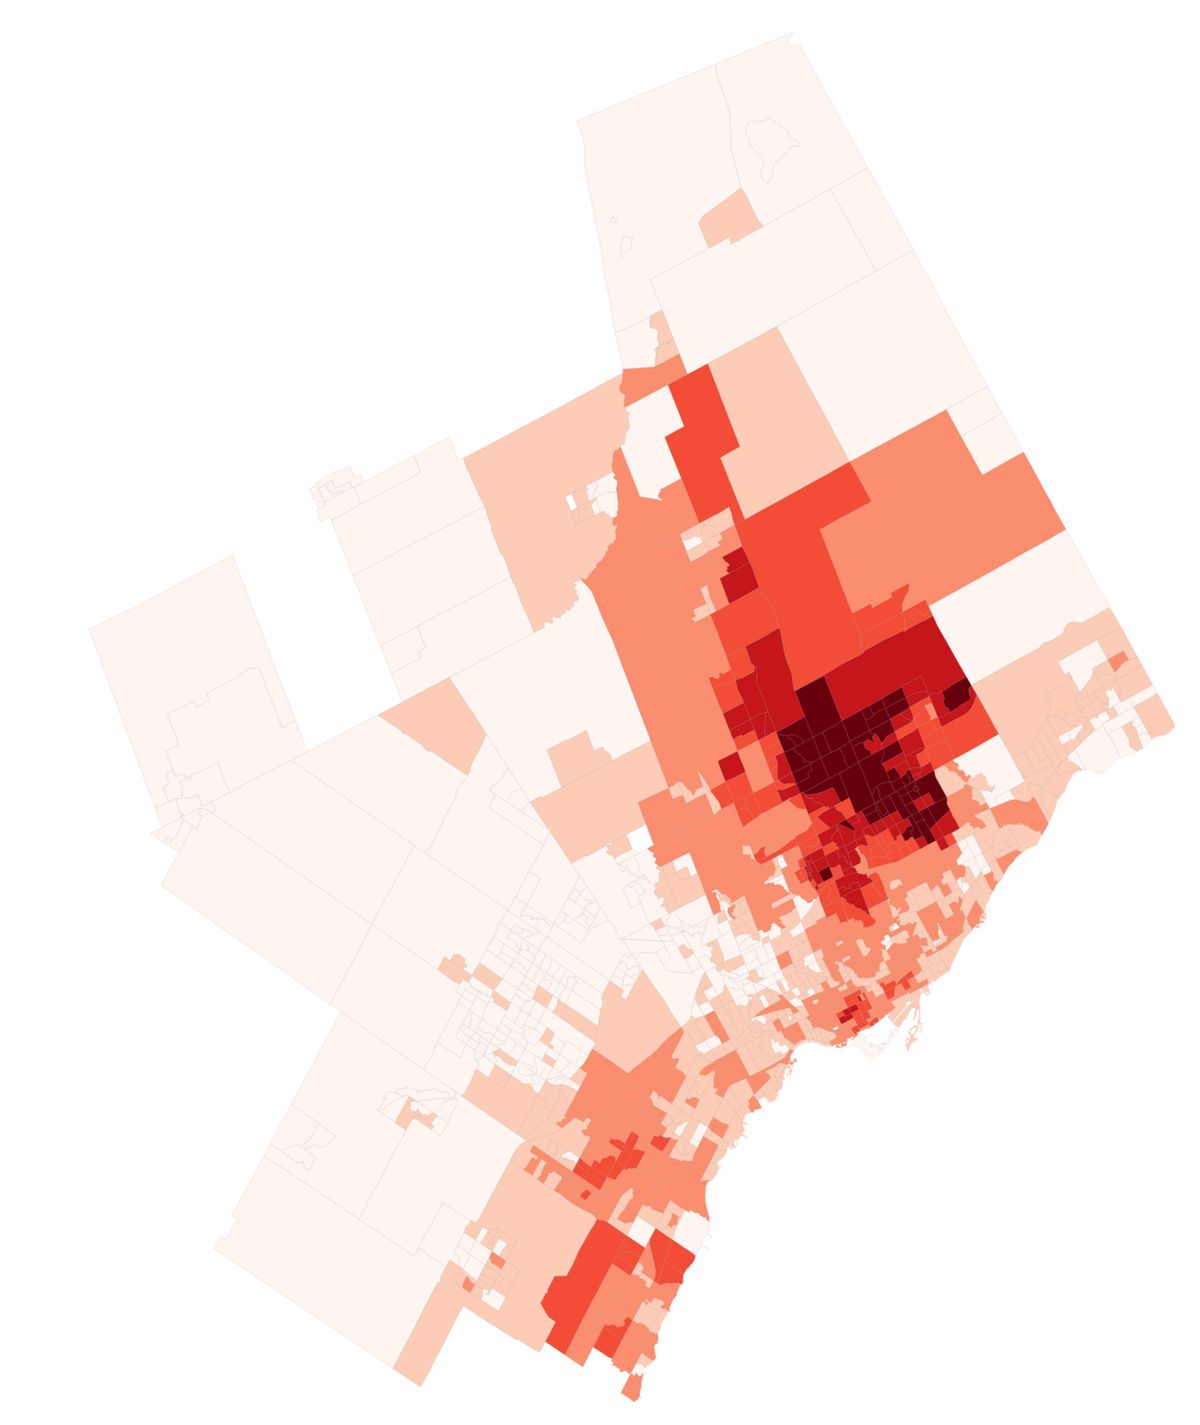
This diversity is distributed across the city's community councils in distinct patterns. In Scarborough, visible minorities constitute the majority, with South Asian (25.4 percent) and Chinese (19.0 percent) as the largest groups. North York also has a majority visible-minority population, led by Chinese (14.0 percent) and South Asian (8.5 percent) communities. Etobicoke York has a more mixed profile, with 48.9 percent White and significant Black (15.7 percent) and South Asian (11.9 percent) populations. Toronto and East York maintains a White majority at 65.3 percent, though with substantial Chinese and South Asian communities. Neighbourhood-level data reveals extremes, such as Milliken, where 97 percent of residents are visible minorities, compared to Kingsway South, where only 12 percent are.
- South Asian: The largest visible minority group at 14.0% of the city's population.
- Chinese: The second-largest group at 10.7%, with strong concentrations in North York and Scarborough.
- Black: Comprises 9.6% of the population, with significant communities in Etobicoke York.
- Latin American: Makes up 3.3% of the city's residents.
- West Asian: Represents 2.5% of the population.
- Arab: A growing community, increasing by 0.2% between 2011 and 2016.
- Aboriginal: An estimated 46,315 individuals live in Toronto.
The city is also home to many established ethnic neighbourhoods that celebrate its multicultural fabric. These include multiple Chinatowns, Corso Italia, Little Italy, Little India, Greektown, Koreatown, Little Tokyo, Little Jamaica, Little Portugal, Little Malta, Roncesvalles (Polish), and Bloor West Village (Ukrainian). These areas serve as cultural hubs and contribute to the city's international character. The Toronto District School Board's 2012 study highlighted the youth dimension of this diversity, finding that 66 percent of students aged 4 to 18 came from visible minorities, with over 61 percent identifying as Asian.
Immigration and Settlement Patterns
Immigration is the primary engine of Toronto's population growth and demographic change. Annually, almost half of all immigrants to Canada choose to settle in the Greater Toronto Area. Data from the 2021 census indicates that 51.2 percent of the Toronto CMA's population was born outside of Canada. The most important source of population growth in recent years has been the increase in the number of non-permanent residents, such as international students and temporary workers.
The settlement patterns of these newcomers have shaped the geographic distribution of ethnic communities across the city and region. Historically, prior to the Second World War, an estimated 80 percent of metropolitan Toronto was of British origin, a figure that declined to around 47 percent by 1981. The continuous influx of immigrants from Asia, the Caribbean, Africa, and Latin America has transformed this demographic landscape. The city's wards and neighbourhoods reflect these settlement waves, with specific areas showing high concentrations of particular groups, such as the Chinese community in Agincourt or the South Asian community in Malvern. This pattern of chain migration and community formation is a key feature of Toronto's urban development, creating distinct cultural districts throughout the city.
Religious Affiliation
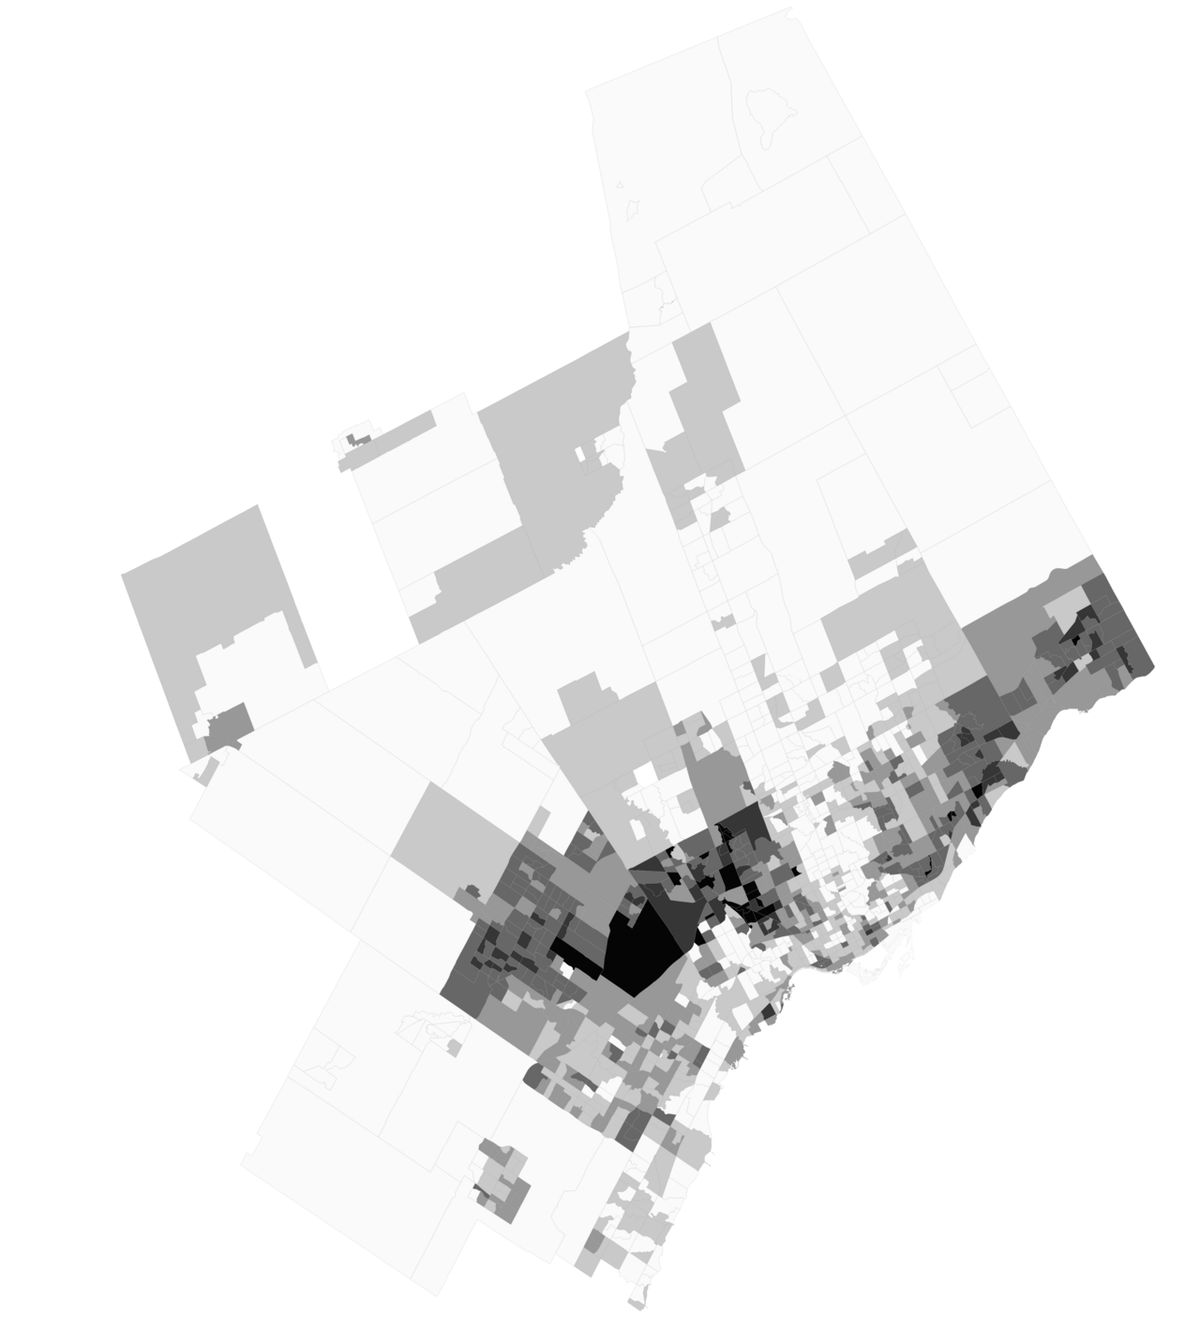
Toronto's religious landscape is as diverse as its ethnic makeup, reflecting the global origins of its residents. According to the 2011 National Household Survey, Roman Catholicism was the largest religious affiliation in the city, claimed by 28.2 percent of the population. This was followed by those reporting no religious affiliation at 24.1 percent. Other Christian denominations collectively accounted for a significant portion, including those identifying simply as 'Other Christian' (9.7 percent), Christian Orthodox (4.3 percent), Anglican (3.8 percent), United Church (3.0 percent), Pentecostal (1.6 percent), Presbyterian (1.5 percent), and Baptist (1.4 percent).
Non-Christian faiths are also well-represented, demonstrating the city's pluralism. Muslims constituted 8.2 percent of the population, Hindus 5.6 percent, Jews 3.8 percent, Buddhists 2.7 percent, and Sikhs 0.8 percent. The distribution of these groups varies by former municipality. For example, in 2001, North York had a higher proportion of Jewish residents (10.1 percent), while Scarborough had a higher proportion of Hindus (9.7 percent). Etobicoke had a notable Sikh population (3.3 percent), and East York had significant Muslim (12.5 percent) and Christian Orthodox (12.0 percent) communities. This religious diversity is visible in the city's array of houses of worship, festivals, and cultural practices that are part of daily life.
Languages Spoken
While English is the predominant language of public life, Toronto is a multilingual city where a vast array of mother tongues are spoken in homes and communities. Data from the 2011 census at the federal riding level provides a detailed snapshot. In many central ridings, English is the mother tongue for a strong majority, such as in Beaches-East York (70.0 percent) and St. Paul's (69.4 percent). However, in several ridings, other languages are spoken by substantial portions of the population, reflecting concentrated immigrant settlement.
In Willowdale, only 35.1 percent reported English as a mother tongue, with Chinese (not otherwise specified) at 9.4 percent, Persian at 9.3 percent, Korean at 7.9 percent, and Mandarin at 7.7 percent. Scarborough-Rouge River had 37.4 percent English speakers, with Tamil (13.8 percent) and Cantonese (13.1 percent) as major languages. In Davenport, English was the mother tongue for 47.5 percent, followed by Portuguese at 21.4 percent. Etobicoke North reported 45.4 percent English speakers, with Panjabi (Punjabi) at 10.1 percent. This linguistic diversity extends to the broader region, with ridings like Bramalea-Gore-Malton in Peel Region reporting Panjabi as the mother tongue for 22.2 percent of residents. The prevalence of languages like Cantonese, Mandarin, Tamil, Tagalog, Persian, Italian, Spanish, and Russian across different parts of the city highlights the connection between language, recent immigration, and community formation.
| Federal Riding (2011) | Top Mother Tongue | Percentage | Second Mother Tongue | Percentage |
|---|---|---|---|---|
| Willowdale | English | 35.1% | Chinese, n.o.s. | 9.4% |
| Scarborough-Rouge River | English | 37.4% | Tamil | 13.8% |
| Davenport | English | 47.5% | Portuguese | 21.4% |
| Etobicoke North | English | 45.4% | Panjabi (Punjabi) | 10.1% |
| York Centre | English | 40.5% | Russian | 11.9% |
Toronto's multilingual reality is supported by its public services, media, and education systems. The city's linguistic diversity is detailed at the federal electoral district level. For example, in the Trinity-Spadina riding, English is the mother tongue for 60.2 percent of the population, with Cantonese, Portuguese, unspecified Chinese, and Mandarin also spoken. In the Davenport riding, English is the mother tongue for 47.5 percent, followed by Portuguese at 21.4 percent. These many languages are part of daily life in Toronto.
Housing and Socioeconomic Indicators
Toronto's demographic growth has intensified pressures on the housing market and highlighted socioeconomic disparities. As of fall 2022, the average market rent for a two-bedroom apartment in Toronto was $1,811, while a studio apartment averaged $1,317. The overall vacancy rate for purpose-built rental homes was a tight 1.7 percent. Affordability is a significant challenge, with 40 percent of Toronto renter households spending more than 30 percent of their pre-tax income on rent. The city administers a substantial social housing portfolio, with 85,536 units under its oversight, yet demand vastly outstrips supply.
In spring 2023, 84,583 people were on the Centralized Waiting List for social housing, facing an average wait time of 13 years for a two-bedroom apartment. These housing challenges exist within a context of significant economic activity and variation. The city is home to a large number of businesses and a dynamic labour force shaped by its immigrant population. However, indicators like the maximum monthly allowance for social assistance highlight the support system's limits, set at $733 for a single adult on Ontario Works in fall 2022. The city's Street Needs Assessment, last conducted in April 2021, provides a point-in-time count of people experiencing homelessness, and the Toronto shelter system remains the largest in Canada. The rapid population growth, largely driven by international migration, continues to test the capacity of housing, transit, and social services infrastructure to keep pace, making demographic trends a central concern for urban policy and planning.
Questions about Demographics of Toronto
What percentage of Toronto's population are immigrants?
Immigrants constitute a majority of the population in the Toronto region. According to the 2021 census, 51.2 percent of the Toronto Census Metropolitan Area's population was born outside of Canada. Nearly half of all immigrants to Canada choose to settle in the Greater Toronto Area each year. In a recent period, almost a quarter of all new permanent residents to Canada settled in Toronto, making international migration the most important driver of the region's population growth.
What languages are most commonly spoken in Toronto?
English is the most common mother tongue and the main language of public life. However, a multitude of other languages are widely spoken at home. Based on 2011 riding-level data, other prominent mother tongues include Cantonese, Mandarin, Tamil, Tagalog (Filipino), Portuguese, Persian, Italian, Spanish, Russian, and Panjabi (Punjabi). In some electoral districts, such as Willowdale and Scarborough-Rouge River, less than 40 percent of the population reported English as their mother tongue.
How has Toronto's population changed recently?
Toronto's population growth accelerated sharply after 2022. This surge was primarily due to a rise in non-permanent residents and sustained high levels of immigration. However, the region continues to see a net outflow of people to other provinces, particularly Alberta. The city's own population grew at a rate of 0.46 percent annually between 2016 and 2021, a pace that has since increased significantly.
What is the population of Toronto?
The population of the City of Toronto was 2,794,356 according to the 2021 census, making it the most populous city in Canada. This represented a growth of 2.3 percent from 2016, with an annual growth rate of 0.46 percent. The broader Toronto Census Metropolitan Area (CMA), which includes suburban municipalities, has a significantly larger population. Projections estimate the CMA's population will reach approximately 6,551,000 by 2026. The city itself is also projected to grow, with an estimate of 3,358,275 residents by 2026.
What are the largest ethnic groups in Toronto?
Toronto has no ethnic majority and is one of the most multicultural cities in the world. As of 2021, 55.7 percent of the city's population identified as a visible minority. The largest visible minority groups are South Asian (14.0 percent), Chinese (10.7 percent), and Black (9.6 percent). In total, approximately 34.81 percent of the city's population, or 961,325 individuals, are Asian Canadians. Annually, almost half of all immigrants to Canada settle in the Greater Toronto Area.
Which Toronto neighbourhoods have the highest visible minority populations?
Several Toronto neighbourhoods have very high visible minority populations according to 2016 census data. Milliken has the highest at 97 percent, with Chinese as the top ethnic origin. Steeles and Agincourt North both have 91 percent visible minority populations, also with Chinese as the top origin. Malvern has a 90 percent visible minority population with East Indian as the top origin. These areas are primarily located in Scarborough and North Etobicoke.
Sources and further reading
- Demographics of Toronto (Wikipedia)
- Toronto at a Glance (toronto.ca)
- Toronto population has topped 7 million, here's how (cp24.com)
Checked by the Your Space Hamilton desk. Last updated 2026-10-24.